
Layman Data Digging: Whether Vaccination is working? Yes!!!
The Covid pandemic has ruined many livelioods and is killing many people. From the onset of Covid , data has taken a center stage. How many cases per day? What is the discharged ratio? How much population vaccinated ? etc.
As lot of data is flowing, I have just tried to figure out how much vaccination is helping?
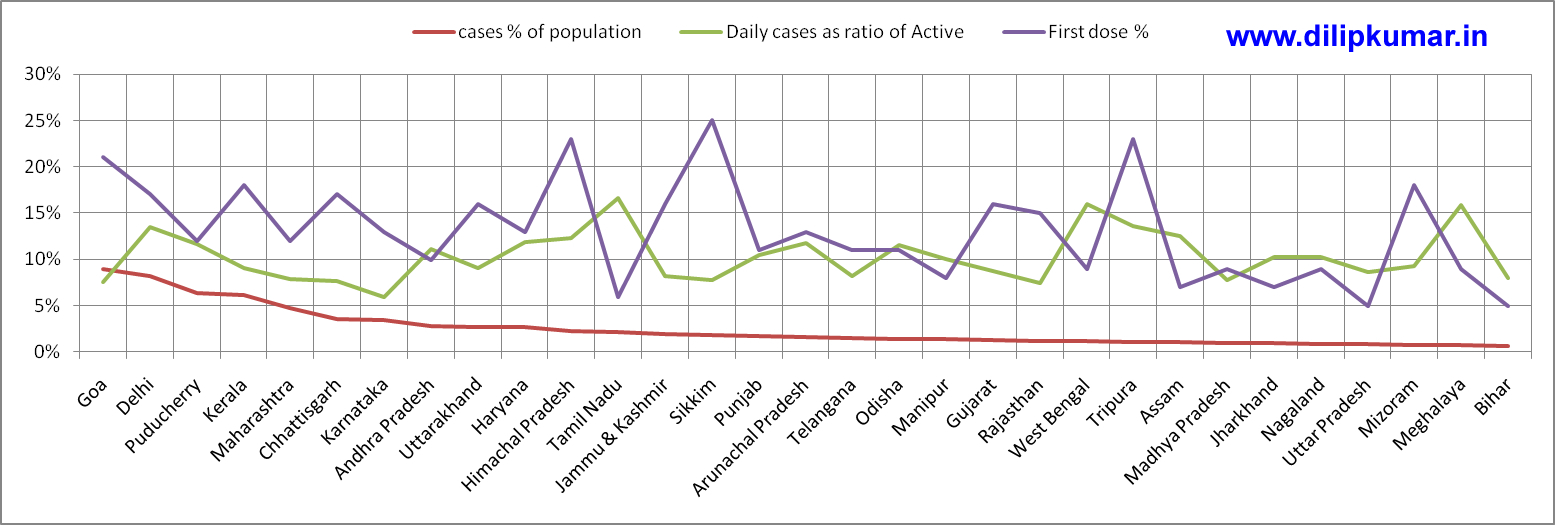
The below graph shows how the vaccination and number of Daily Active cases- 13th May case (as a % of active cases ) are related or trying to see the relation.
(Move Mouse over to see the graph zoomed and clear)
You have to zoom in on mobile to see properly.
Inferences from the Graph -
- Vaccine seems to be working - The States on X-axis are in descending order of the Percentage of Population affected. Whenever there is a spike in vaccination % there is an observable drop in daily cases % (of active cases on date).
- Whenever there is a drop in the vaccine % there is an observable spike in the daily cases %.
- Another visible trend is that states with less percentage of population infected are showing higher daily case % (of the active case losd). This trend is mitigated in states with higher vaccination.
- States which have better vaccination % , there is a drop in daily reported cases (% of active cases) - Tripura, Nagaland, Mizoram, Madhya Pradesh, kerala, Gujarat, Odisha.
- Tamilnadu with less vaccination percentage has higher reported cases compared to other states with similar % infected population like Himachal pradesh , J&K .
- Sikkim with better vaccination cases are less.
- Punjab with less vaccination, per day cases are more.
- West bengal and Andhra Pradesh are peculiar cases with less vaccination percentage, their per day cases are comparatively higher.
- Uttarpradesh is having less vaccination % and cases can go further high.
- Bihar seems to be an exception even though vaccination % is less the per day active cases seems to be less.
Conclusion - Vaccination seems to be working and is the only tool which we have right now.
Following are the assumptions based on which data has been arrived-
- Population of 2021 was assumed by Population of 2011 x 0.7 X Decadal growth rate of 2001-2011
- Covid vacciantion data are arrived by number of population who got atleast one dose / population arrived as (1) above
- Daily cases as percentage of active cases are arrived by dividing the cases reported on Mygov.in/ active cases as on that date. This I opine gives how fast the disease is spreading. Active cases are the cases which have come recently and would have spread the virus to others. Old cases have no much impact.